To jest stara wersja strony!
Process mining in Python
Requirements
Python 3.x, opyenxes, pygraphviz.
Implementing a simple heuristic miner
Using the following excerpt of code import a repairExample.xes file into your Python script:
from opyenxes.data_in.XUniversalParser import XUniversalParser

path = 'repairExample.xes'

with open(path) as log_file:
    # parse the log
    log = XUniversalParser().parse(log_file)[0]
Take a look at the log variable.
Using log.get_features() or log.get_attributes(), you can check some information about the log.
As the parsed log consists of lists of events, you can also select a single event and check its attributes:
event = log[0][0]
event.get_attributes()
For ease of further work, we will create a workflow_log consisting of names of events:
workflow_log = []
for trace in log:
    workflow_trace = []
    for event in trace[0::2]:
        # get the event name from the event in the log
        event_name = event.get_attributes()['Activity'].get_value()
        workflow_trace.append(event_name)
    workflow_log.append(workflow_trace)
To create a simple heuristic net of task (simplified process model like in Disco tool), we will create a structure in which for each event, we gather a set of all events that precede this event:
w_net = dict()
for w_trace in workflow_log:
    for i in range(0, len(w_trace)-1):
        ev_i, ev_j = w_trace[i], w_trace[i+1]
        if ev_i not in w_net.keys():
            w_net[ev_i] = set()
        w_net[ev_i].add(ev_j)
Take a closer look at the w_net dictionary:
{'Analyze Defect': {'Inform User', 'Repair (Complex)', 'Repair (Simple)'},
 'Archive Repair': {'End'},
 'Inform User': {'Archive Repair', 'End', ...},
 ...}
It represents the connections between events:
| | Analyze Defect | Archive Repair | Inform User | … | End |
| Analyze Defect | | | → | | |
| Archive Repair | | | | | → |
| Inform User | → | | | | → |
| … | | | | | |
| End | | | | | |
Using Pygraphviz, we can render an image depicting the process:
import pygraphviz as pgv
G = pgv.AGraph(strict=False, directed=True)
G.graph_attr['rankdir'] = 'LR'
G.node_attr['shape'] = 'Mrecord'
for event in w_net:
    G.add_node(event, style="rounded,filled", fillcolor="#ffffcc")
    for preceding in w_net[event]:
        G.add_edge(event, preceding)

G.draw('simple_heuristic_net.png', prog='dot')
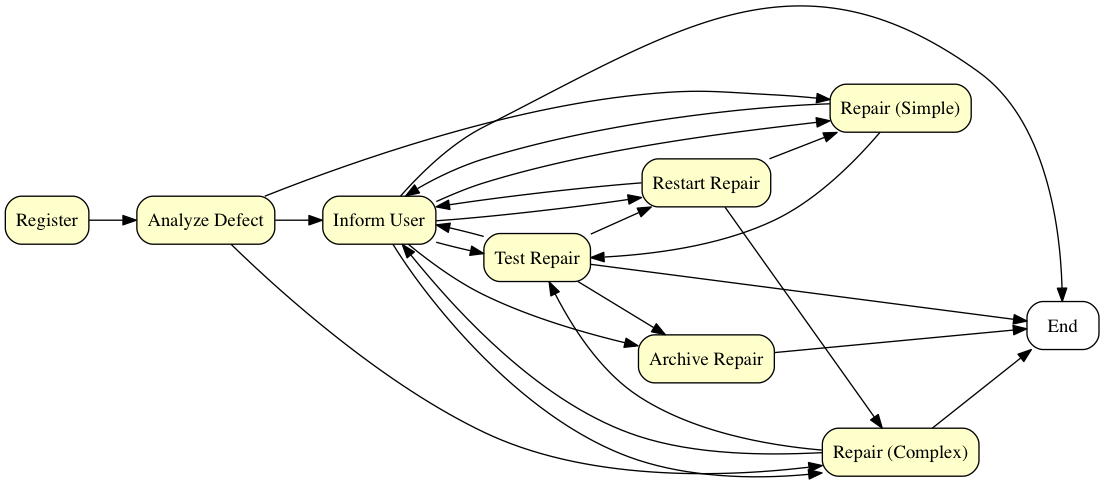
Diagram enhancing
In Disco, we could see the frequencies of tasks. Let's count such frequency:
ev_counter = dict()
for w_trace in workflow_log:
    for ev in w_trace:
        ev_counter[ev] = ev_counter.get(ev, 0) + 1
Then, in our model, we can just change the label to include the result of calculation:
text = event + ' (' + str(ev_counter[event]) + ")"
G.add_node(event, label=text, style="rounded,filled", fillcolor="#ffffcc")
We can also change the transparency of the discovered tasks based on their frequencies:
color_min = min(ev_counter.values())
color_max = max(ev_counter.values())

G = pgv.AGraph(strict=False, directed=True)
G.graph_attr['rankdir'] = 'LR'
G.node_attr['shape'] = 'Mrecord'
for event in w_net:
    value = ev_counter[event]
    color = int(float(color_max-value)/float(color_max-color_min)*100.00)
    my_color = "#ff9933"+str(hex(color))[2:]
    G.add_node(event, style="rounded,filled", fillcolor=my_color)
    for preceding in w_net[event]:
        G.add_edge(event, preceding)

G.draw('simple_heuristic_net_with_colors.png', prog='dot')
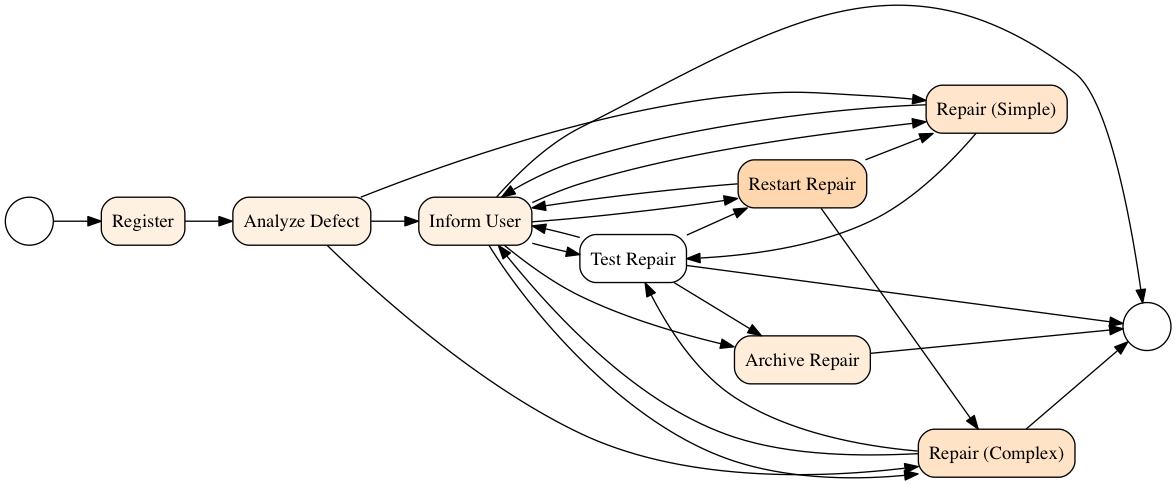
We can also try to discover start and end events and correct the model:
from functools import reduce
ev_source = set(w_net.keys())
ev_target = reduce(lambda x,y: x|y, w_net.values())
ev_start_set = ev_source - ev_target
print("start set: {}".format(ev_start_set))
ev_end_set = ev_target - ev_source
print("end set: {}".format(ev_end_set))

for ev_end in ev_end_set:
    end = G.get_node(ev_end)
    end.attr['shape']='circle'
    end.attr['label']=''

G.add_node("start", shape="circle", label="")
for ev_start in ev_start_set:
    G.add_edge("start", ev_start)

G.draw('simple_heuristic_net_with_events.png', prog='dot')
Excercise

