To jest stara wersja strony!
Process mining in Python
Requirements
Python 3.x, opyenxes, pygraphviz.
Implementing a simple heuristic miner
Using the following excerpt of code import a repairexample.xes file into your Python script:
from opyenxes.data_in.XUniversalParser import XUniversalParser

path = 'repairExample.xes'

with open(path) as log_file:
    # parse the log
    log = XUniversalParser().parse(log_file)[0]
Take a look at the log variable.
Using log.get_features() or log.get_attributes(), you can check some information about the log.
As the parsed log consists of lists of events, you can also select a single event and check its attributes:
event = log[0][0]
event.get_attributes()
For ease of further work, we will create a workflow_log consisting of names of events:
workflow_log = []
for trace in log:
    workflow_trace = []
    for event in trace[0::2]:
        # get the event name from the event in the log
        event_name = event.get_attributes()['Activity'].get_value()
        workflow_trace.append(event_name)
    workflow_log.append(workflow_trace)
To create a simple heuristic net of task (simplified process model like in Disco tool), we will create a structure in which for each event, we gather a set of all events that precede this event:
w_net = dict()
for w_trace in workflow_log:
    for i in range(0, len(w_trace)-1):
        ev_i, ev_j = w_trace[i], w_trace[i+1]
        if ev_i not in w_net.keys():
            w_net[ev_i] = set()
        w_net[ev_i].add(ev_j)
Take a closer look at the w_net dictionary:
{'Analyze Defect': {'Inform User', 'Repair (Complex)', 'Repair (Simple)'},
 'Archive Repair': {'End'},
 'Inform User': {'Archive Repair', 'End', ...},
 ...}
It represents the connections between events:
| | Analyze Defect | Archive Repair | Inform User | … | End |
| Analyze Defect | | | → | | |
| Archive Repair | | | | | → |
| Inform User | → | | | | → |
| … | | | | | |
| End | | | | | |
Using Pygraphviz, we can render an image depicting the process:
import pygraphviz as pgv
G = pgv.AGraph(strict=False, directed=True)
G.graph_attr['rankdir'] = 'LR'
G.node_attr['shape'] = 'Mrecord'
for event in w_net:
    G.add_node(event, style="rounded,filled", fillcolor="#ffffcc")
    for preceding in w_net[event]:
        G.add_edge(event, preceding)

G.draw('simple_heuristic_net.png', prog='dot')
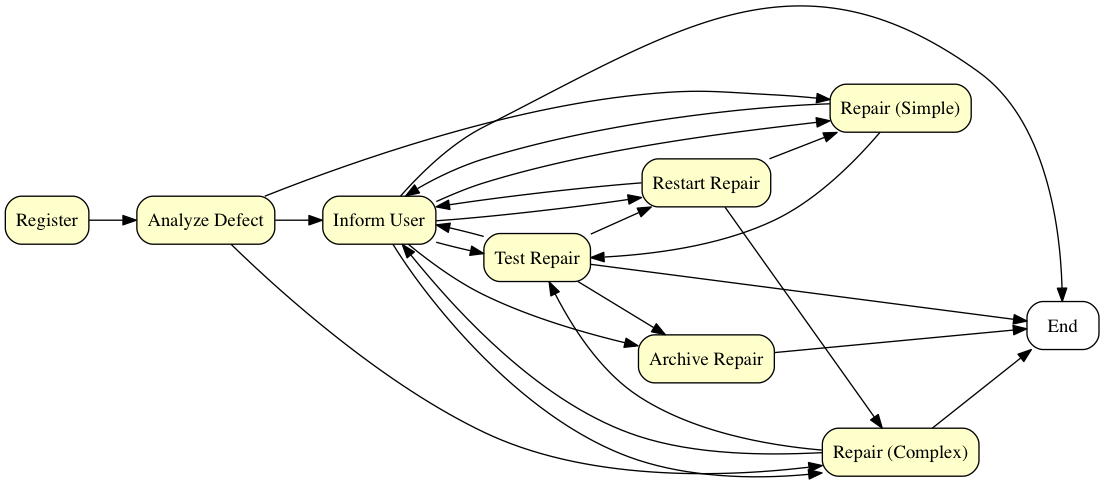
Diagram enhancing
In Disco, we could see the frequencies of tasks. Let's count such frequency:
ev_counter = dict()
for w_trace in workflow_log:
    for ev in w_trace:
        ev_counter[ev] = ev_counter.get(ev, 0) + 1
Then, in our model, we can just change the label to include the result of calculation:
text = event + ' (' + str(ev_counter[event]) + ")"
G.add_node(event, label=text, style="rounded,filled", fillcolor="#ffffcc")
We can also change the transparency of the discovered tasks based on their frequencies:
color_min = min(ev_counter.values())
color_max = max(ev_counter.values())

G = pgv.AGraph(strict=False, directed=True)
G.graph_attr['rankdir'] = 'LR'
G.node_attr['shape'] = 'Mrecord'
for event in w_net:
    value = ev_counter[event]
    color = int(float(color_max-value)/float(color_max-color_min)*100.00)
    my_color = "#ff9933"+str(hex(color))[2:]
    G.add_node(event, style="rounded,filled", fillcolor=my_color)
    for preceding in w_net[event]:
        G.add_edge(event, preceding)

G.draw('simple_heuristic_net_with_colors.png', prog='dot')
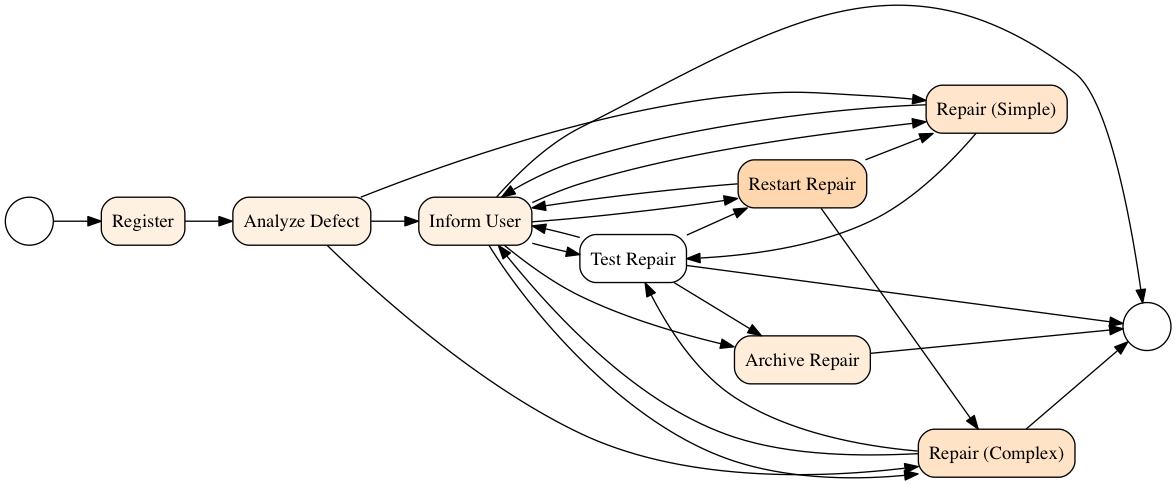
We can also try to discover start and end events and correct the model:
from functools import reduce
ev_source = set(w_net.keys())
ev_target = reduce(lambda x,y: x|y, w_net.values())
ev_start_set = ev_source - ev_target
print("start set: {}".format(ev_start_set))
ev_end_set = ev_target - ev_source
print("end set: {}".format(ev_end_set))

for ev_end in ev_end_set:
    end = G.get_node(ev_end)
    end.attr['shape']='circle'
    end.attr['label']=''

G.add_node("start", shape="circle", label="")
for ev_start in ev_start_set:
    G.add_edge("start", ev_start)

G.draw('simple_heuristic_net_with_events.png', prog='dot')
graphviz instead of pygraphviz
It is possible to use graphviz instead of pygraphviz, but it has different syntax, e.g.:
import graphviz
G = graphviz.Graph()
for event in net:
    G.node(event, style="rounded,filled", fillcolor="#ffffcc")
    for preceding in net[event]:
        G.edge(event, preceding)

G.graph_attr['rankdir'] = 'LR'
G.node_attr['shape'] = 'Mrecord'
G.edge_attr.update(penwidth='2')
G.node("End", shape="circle", label="")
G.render('simple_graphviz_graph')
Excercise
Extend process discovery with additional features:
Try to discover frequency of each transition (flow) and render the number of occurrences both as a label and the thickness of the line.
Add some filtering option to show or hide tasks or flows according to the chosen threshold.

Try to implement and discover relations according to the Alpha algorithm.

